

HPE Private Cloud AI (PCAI) runs large‑scale AI and machine learning (ML) workloads on its underlying Kubernetes (K8s) cluster with a large number of K8s Pods executing long‑lived, resource‑intensive jobs. Due to K8s' inherently ephemeral design, Pod restarts are common and expected operational events. However, certain Pod restarts can disrupt long‑running training workloads, interrupt inference services, or degrade data-processing pipelines, making it essential to proactively understand the cause of each Pod restart. Ensuring reliability at PCAI scale requires early visibility into every Pod restart event so engineering teams can quickly detect anomalies and remediate issues before they impact AI workloads. Although K8s provides native diagnostics through node conditions, event streams, container state information, and Pod-level status, engineers must manually perform the same sequence of investigative commands for each restart event. This operational workflow does not scale effectively in PCAI's large-cluster environment, where workloads are long-running, compute-intensive, and highly sensitive to interruptions.
This blog post introduces an automated Pod restart analysis pipeline designed to eliminate this manual operational burden. Whenever a Pod restart is detected, the system automatically triggers a Pod information collector, gathers relevant diagnostic data including node conditions, Pod events, and contextual signals, and publishes a structured diagnostic report directly to Slack. Engineers receive immediate, actionable insight without running a single command. This automation improves observability on the PCAI cluster, accelerates troubleshooting and root-cause identification, and reduces manual overhead, helping ensure AI workloads remain stable, predictable, and easier to support within the HPE Private Cloud AI environment.
The mystery behind every Pod restart
In large K8s environments, Pod restarts are unavoidable. They can be triggered by memory pressure, transient node instability, failing liveness or readiness probes, application crashes, or simply the platform’s normal reconciliation behavior. In most cases, these restarts are expected and have minimal impact. However, in AI and data intensive platforms such as HPE Private Cloud AI, even a single unexpected Pod restart can have downstream effects, slowing long‑running training jobs, interrupting inference services, or degrading user‑facing workload performance.
The real challenge is not that Pods restart, but understanding why they restart at PCAI scale and doing so quickly enough to prevent minor issues from evolving into major incidents. At scale, Pod restart investigation becomes a tedious, repetitive and error-prone operational task, requiring engineers to execute multiple kubectl commands, inspect logs, review Pod events, examine node conditions, and manually reconstruct the sequence of events leading up to the restart. When multiplied across dozens or hundreds of Pods, this workflow creates a significant operational burden and does not scale effectively in large PCAI environments.
Fortunately, this entire troubleshooting workflow can be automated using existing tooling. This blog post presents an automated Pod restart analysis pipeline built around an existing open-source tool, k8s-pod-restart-info-collector. After being deployed into PCAI through Import Framework, the tool acts as a dedicated watchdog for Pod restart events, automatically collecting diagnostic information, including node conditions, Pod events, and other contextual signals associated with the affected workload Pods. It then captures the complete operational context behind each Pod restart and delivers a structured diagnostic report directly to a Slack channel. By automating the detection, collection, and analysis of Pod restart diagnostics, this solution eliminates repetitive manual troubleshooting tasks, accelerates root-cause analysis, and significantly improves observability across PCAI clusters.
Pod restart information collector
k8s-pod-restart-info-collector is an open-source K8s troubleshooting tool developed by Airwallex. Implemented as a K8s custom controller using the client-go library, the tool continuously monitors Pod lifecycle changes through the K8s API and automatically captures diagnostic information whenever a Pod restart is detected. Rather than requiring engineers to manually collect logs, events, exit codes, timestamps, and runtime context from multiple K8s resources, the controller automatically gathers and consolidates this information into a structured diagnostic report and delivers it directly to a designated Slack channel.
By providing immediate visibility into Pod restart causes and surrounding operational context, the tool transforms Pod restart events from isolated signals into actionable operational insights. This helps platform engineering and SRE teams accelerate root-cause analysis, reduce troubleshooting effort, and identify recurring reliability issues across large-scale K8s environments.
The following sections describe how to leverage this open-source solution by deploying k8s-pod-restart-info-collector within HPE Private Cloud AI and integrating it with a dedicated Slack channel. By building on PCAI's existing K8s infrastructure, this approach automates Pod restart diagnostics, improves observability, and accelerates troubleshooting across PCAI environments.
Prerequisites
Ensure that the following prerequisites are fulfilled:
- HPE Private Cloud AI version 1.6.0 or later, running HPE AI Essentials version 1.9.1 or later.
- Access to an HPE Private Cloud AI workspace (with the Private Cloud AI Administrator role), allowing to perform administrative operations.
- Slack app, a Slack channel and Webhook URL.
The deployment examples in the following sections use the kubectl CLI and the kubeconfig to display deployment details in the PCAI K8s cluster for illustration purposes only. Direct cluster access via kubectl is generally not required, as the full framework setup can be completed through the Import Framework UI.
Configure a Slack channel and Webhook URL
Slack is a cloud-based collaboration platform that brings people, information, and tools together in a single workspace. It enables teams to communicate through organized channels, collaborate in real time, and quickly access shared conversations, documents, and operational information efficiently.
In HPE Private Cloud AI environment, Slack channels provide immediate visibility into Pod restart events, including Pod restart reasons, logs, K8s events, and other diagnostic information collected during the restart-analysis process. By centralizing critical operational insights and alerts in a common collaboration platform, Slack enables teams to detect issues faster, collaborate more effectively, and accelerate troubleshooting and resolution, ultimately improving operational efficiency and platform reliability.
If you do not already have a Slack account, you can create one by following Slack’s Getting Started guide.
In this blog post, the HPE Slack account and its associated workspace, HPE, is used as the environment for hosting the Slack channel, Webhook URL, and associated workspace API token required for integration with k8s-pod-restart-info-collector.
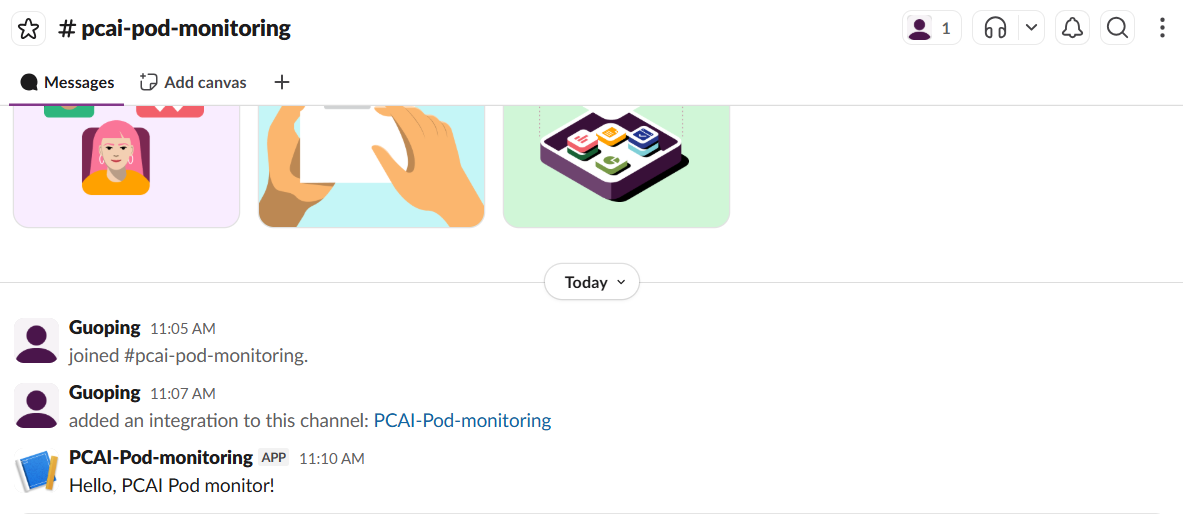
The following example shows the Slack channel, pcai-pod-monitoring, created within the HPE workspace, along with its associated Webhook URL configuration used to receive automated Pod restart notifications and diagnostic reports.

Run the following curl command to post a test message to the Slack channel using the configured Slack Webhook URL.
$ curl -X POST -H 'Content-type: application/json' --data '{"text":"Hello, PCAI Pod monitor!"}' https://hooks.slack.com/services/<hidden>
After running the command, the message 'Hello, PCAI Pod monitor!' is successfully delivered to the Slack channel # pcai-pod-monitoring.
Deploy Pod restart information collector via Import Framework
Based on the official k8s-pod-restart-info-collector Helm charts maintained by Airwallex, a revised version, available in the GitHub repository 'pcai-helm-examples', provides HPE Private Cloud AI compatible deployment configurations. The updated Helm chart includes the required Istio VirtualService and Kyverno ClusterPolicy resources to align with PCAI’s service mesh and policy controls. Prior to deployment, update the values of clusterName, slackWebhookUrl, and slackChannel to match the target PCAI cluster and the Slack configuration used in your environment.
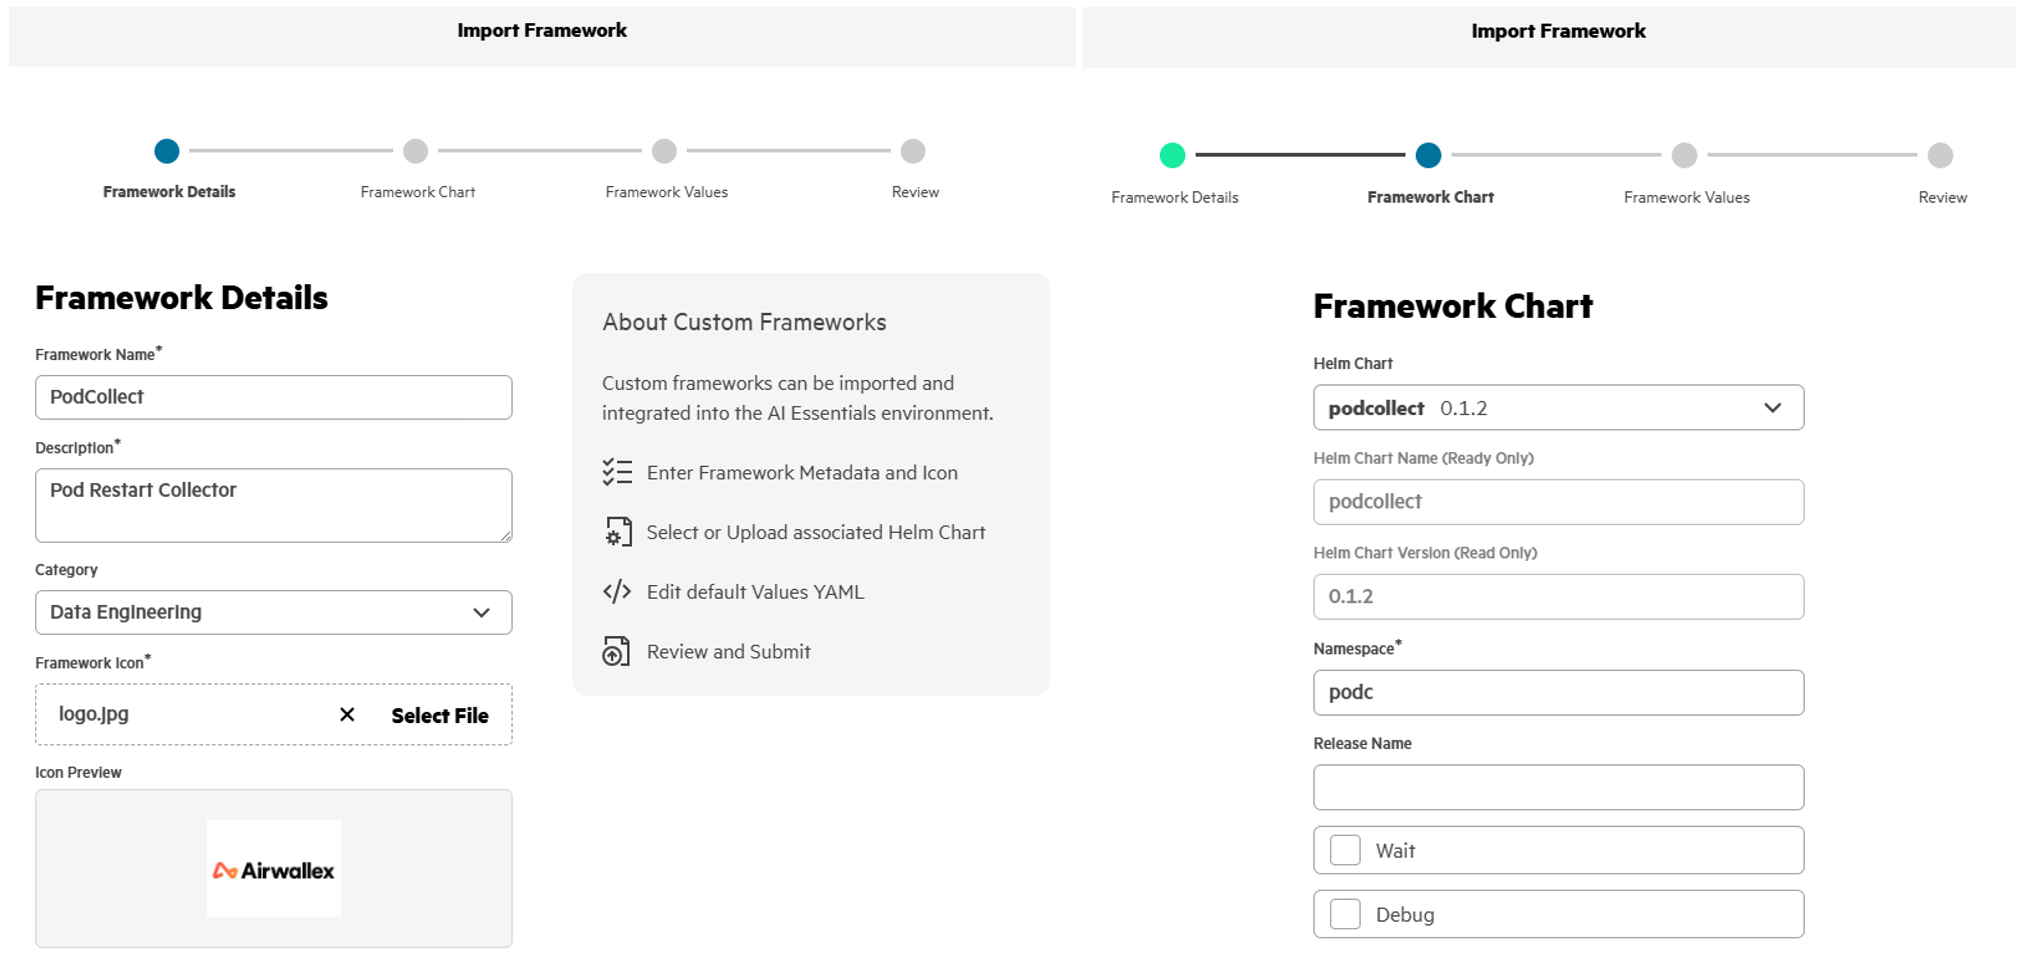
Follow the steps below to deploy the Pod restart information collector, 'PodCollect', into HPE Private Cloud AI using Import Framework.
- In the PCAI left navigation panel, select Tools & Frameworks. Click Import Framework.

- By following the Import Framework wizard workflow, PodCollect can be deployed into the PCAI environment within minutes.
- Run the following kubectl commands to verify that PodCollect has been successfully deployed in the namespace 'podc' of the PCAI K8s cluster.
$ kubectl get all -n podc
NAME                              READY   STATUS    RESTARTS   AGE
pod/podcollect-66dff44cb8-gdc5h   1/1     Running   0          95m

NAME                         READY   UP-TO-DATE   AVAILABLE   AGE
deployment.apps/podcollect   1/1     1            1           4h9m

NAME                                    DESIRED   CURRENT   READY   AGE
replicaset.apps/podcollect-66dff44cb8   1         1         1       95m
replicaset.apps/podcollect-778547dcc9   0         0         0      4h9m
replicaset.apps/podcollect-b68c587b7    0         0         0       97m
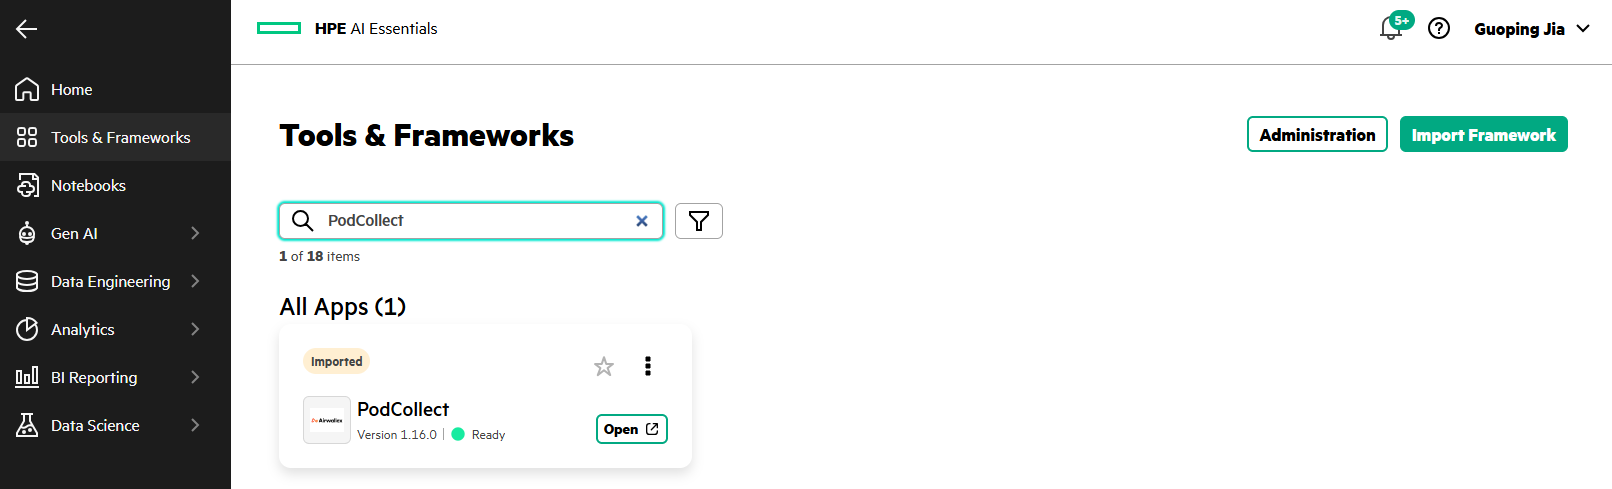
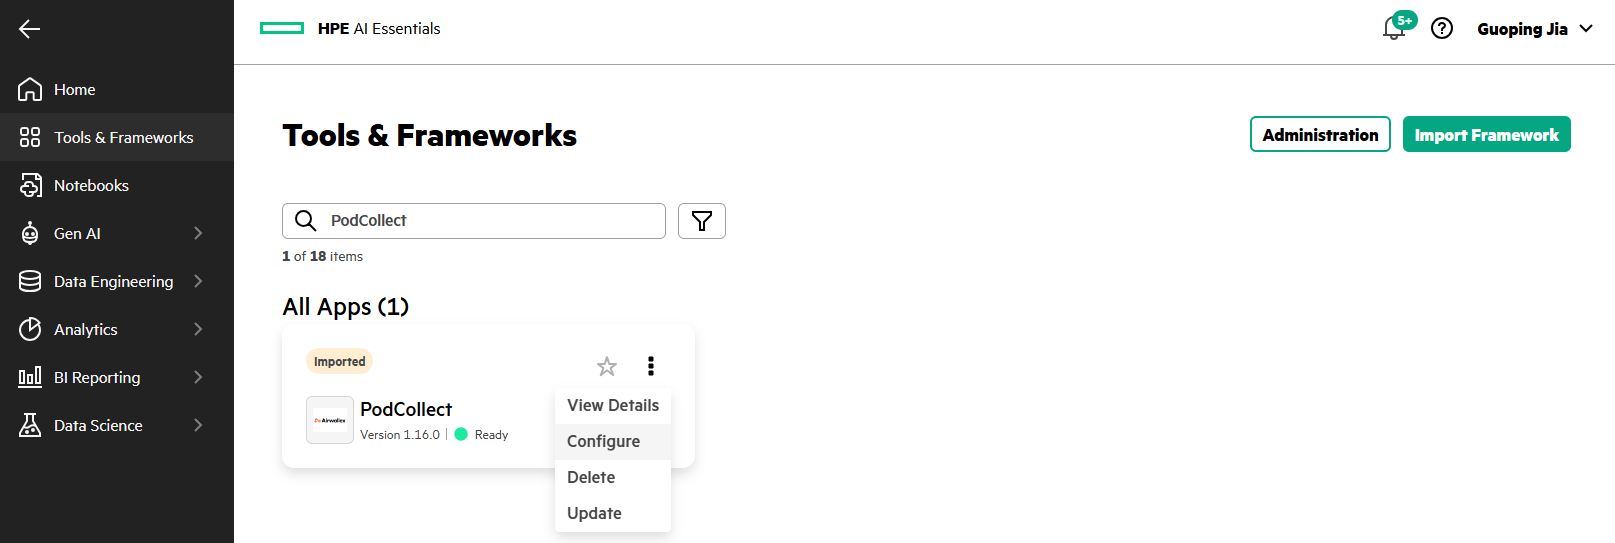
- After the Pod restart information collector is deployed, an imported PodCollect tile appears under Tools & Frameworks.
Demonstrate Pod restarts through memory stress testing
To validate the capabilities of the deployed Pod restart information collector, a test K8s Pod was created and placed under memory pressure using polinux/stress, a lightweight utility for generating synthetic CPU, memory, I/O, and other system workloads. By increasing the Pod's memory consumption beyond its allocated resources, the test triggered an Out-of-Memory (OOM) condition, causing K8s to terminate and restart the Pod as expected. This controlled scenario demonstrated the collector’s ability to detect Pod restart events, automatically gather relevant diagnostic information, and publish the results to Slack, enabling faster troubleshooting and operational analysis under realistic failure conditions.
The following YAML manifest defines the test K8s Pod 'oom-demo'.
$ cat oom-pod.yaml
apiVersion: v1
kind: Pod
metadata:
  name: oom-demo
spec:
  containers:
  - name: oomkilled-demo
    image: polinux/stress
    resources:
      requests:
        memory: "100Mi"
      limits:
        memory: "200Mi"
    command: ["stress"]
    args: ["--vm", "1", "--vm-bytes", "250M", "--vm-hang", "1"]
Run the following command to deploy the Pod 'oom-demo' to the namespace 'podc'.
$ kubectl apply -f oom-pod.yaml -n podc
pod/oom-demo created
After a brief period in the 'Running' state, the deployed Pod 'oom-demo' transitions to 'CrashLoopBackOff' and then is OOMKilled due to an OOM condition. K8s restarts the Pod according to its restart policy. Because the underlying memory-pressure condition remains unchanged, the restarted Pod encounters the same OOM condition and is OOMKilled again. This restart cycle continues repeatedly, causing the RESTARTS count to increase over time.
$ kubectl  get pods -n podc -w
NAME                          READY   STATUS             RESTARTS     AGE
oom-demo                      0/1     CrashLoopBackOff   1 (3s ago)    10s
oom-demo                      0/1     OOMKilled          2 (18s ago)   25s
oom-demo                      0/1     CrashLoopBackOff   2 (12s ago)   36s
oom-demo                      1/1     Running            3 (25s ago)   49s
oom-demo                      0/1     OOMKilled          3 (26s ago)   50s
oom-demo                      0/1     CrashLoopBackOff   3 (13s ago)   62s
oom-demo                      0/1     OOMKilled          4 (44s ago)   93s
oom-demo                      0/1     CrashLoopBackOff   4 (14s ago)  107s
...
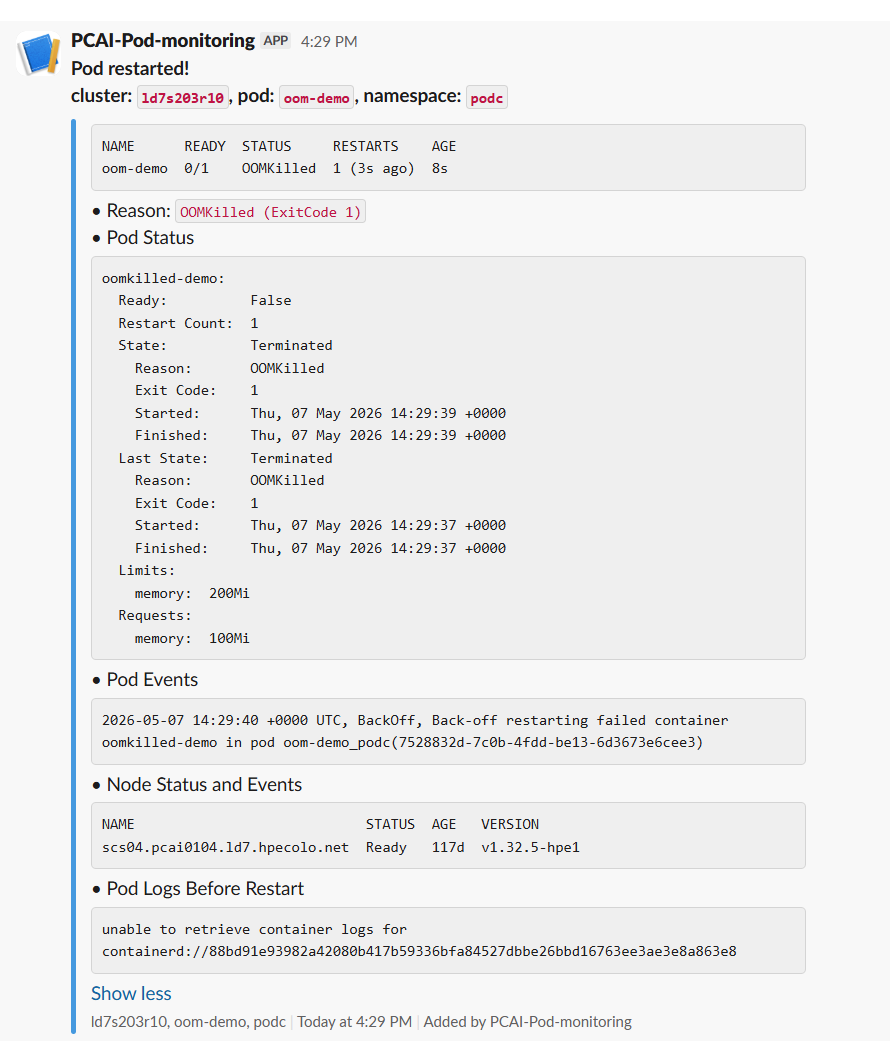
The Pod restarted! alert was sent to the Slack channel 'pcai-pod-monitoring', displaying the Pod name oom-demo and its namespace podc.
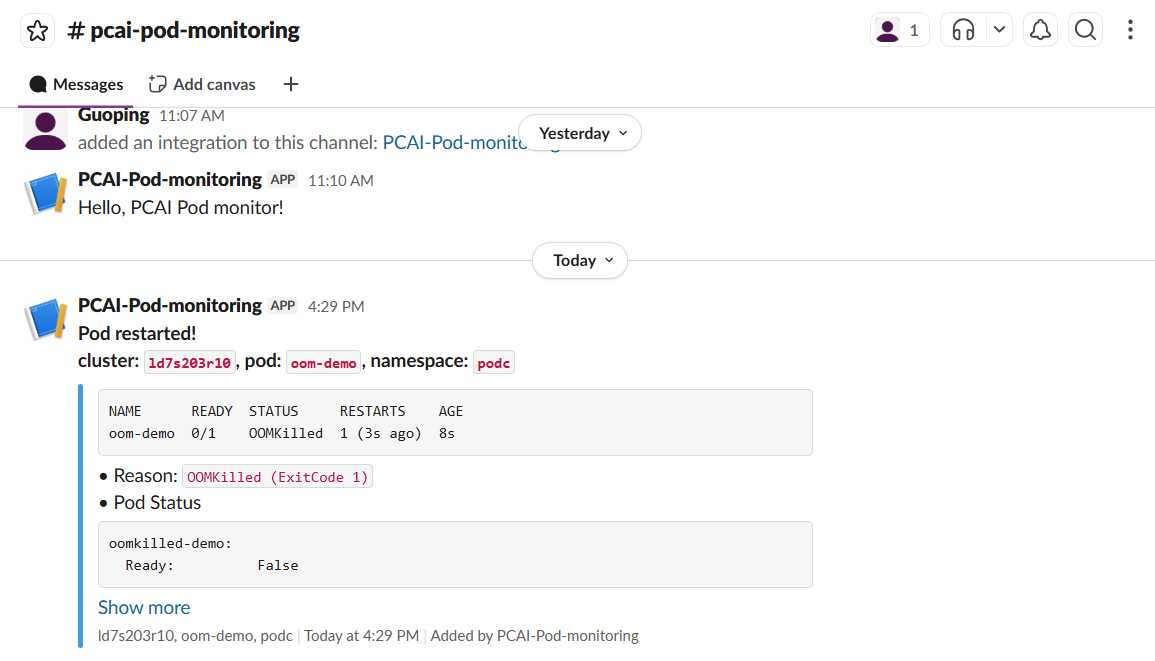
Click Show more to display a detailed Slack alert message that includes Reason, Pod Status, Pod Events, Node Status and Events, and Pod Logs Before Restart.
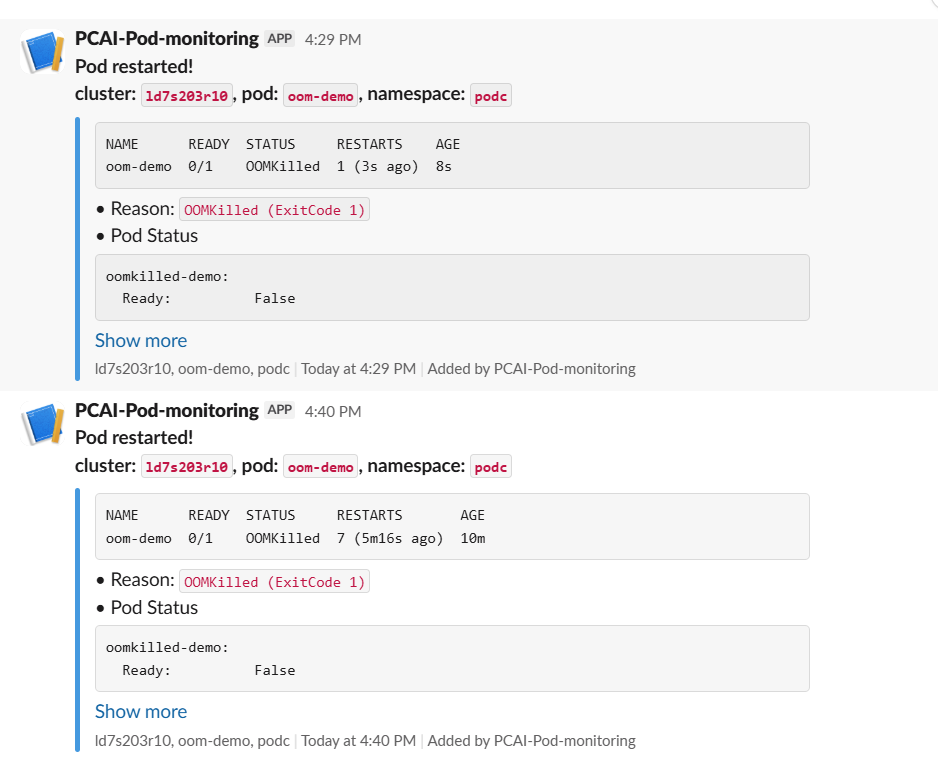
The Pod restart information collector deployment uses the default muteSeconds value of 600 seconds (10 minutes) to suppress duplicate Pod restart alerts within the configured mute window. After the 10-minute mute period expires, a new Pod restart alert is sent to the Slack channel.
Click Configure on the PodCollect tile under Tools & Frameworks to update the Pod restart information collector configuration. You can customize a variety of settings, including 'watchedPodNamePrefixes' to monitor specific Pod name prefixes associated with your AI workloads, and 'watchedNamespaces' to limit monitoring to the namespaces where your AI workloads are deployed. This flexibility allows you to scope Pod restart monitoring to the workloads and namespaces that are most relevant to your environment.
Conclusion
This blog post explored the challenges associated with troubleshooting Pod restart events in K8s environments, particularly within HPE Private Cloud AI deployments where large-scale AI and machine learning workloads require high levels of availability, performance, and reliability. Traditional troubleshooting approaches often require engineers to manually collect and analyze diagnostic information for each Pod restart event, resulting in repetitive workflows, slower root-cause analysis, and increased operational overhead.
To address these challenges, this blog post introduced an automated solution that integrates the open-source k8s-pod-restart-info-collector into the HPE Private Cloud AI platform. The solution continuously monitors Pod restart events, automatically collects relevant diagnostic information from Pods and nodes, and publishes the resulting insights directly to Slack. By eliminating the need for manual data collection and analysis, the solution streamlines the troubleshooting process and enables engineering teams to identify and resolve issues more quickly.
By leveraging proven open-source tooling and automating the end-to-end diagnostic workflow, this approach improves observability on PCAI K8s clusters, accelerates troubleshooting and root-cause identification, and reduces the operational burden on platform and SRE teams. Ultimately, it helps enhance the stability, reliability, and operational efficiency of AI workloads, enabling organizations to operate HPE Private Cloud AI environments more effectively at scale.
Please keep coming back to the HPE Developer Community blog to learn more about HPE Private Cloud AI and get more ideas on how you can use it in your everyday operations.
Related

Beyond generic AI: achieve contextual accuracy with HPE's Knowledge Bases
Apr 15, 2025
Accessing HPE Ezmeral Data Fabric Object Storage from Spring Boot S3 Micro Service deployed in K3s cluster
Sep 13, 2021Automating application deployments to MKS clusters using GitOps with Argo CD
Jan 13, 2026
Deep Learning Model Training – A First-Time User’s Experience with Determined - Part 1
Apr 14, 2022Deep Learning Model Training – A First-Time User’s Experience with Determined – Part 2
May 3, 2022Provisioning Kubernetes clusters using app blueprint with Ansible integration in HPE Private Cloud Enterprise
Oct 3, 2025Exposing applications using Ingress and TLS termination on Kubernetes in HPE GreenLake for Private Cloud Enterprise
Mar 20, 2024